92% Compliance, NPS 68, Google 3.6 Stars. Which One Should You Believe?

April 15, 2026 / 5 min read

Topics

Customer ExperienceMystery ShoppingLocal MarketingNPSVoC

92% Compliance, NPS 68, Google 3.6 Stars. Which One Should You Believe?

Why your customer experience data seems to contradict itself, and what that is actually costing you

Three Numbers. Three Realities. One Problem Nobody Sees.

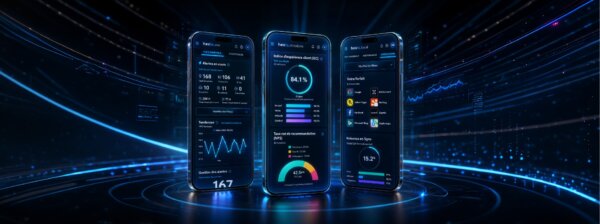
Picture a multi-location restaurant chain. Their numbers look solid, even impressive.

Their professional mystery shoppers rate operational compliance at 92%. Their internal VoC NPS sits at 68. Respectable. Their Google reviews? 3.6 stars, with a strongly negative connotation.

Three metrics. Three different realities. Three ways of looking at the customer experience. Leadership does not know what to believe.

This scenario is not hypothetical. It represents the reality of most multi-location chains we work with at Lanla.

And the answer to the question “which one should you believe?” is always the same: all three. Because they are not measuring the same thing.

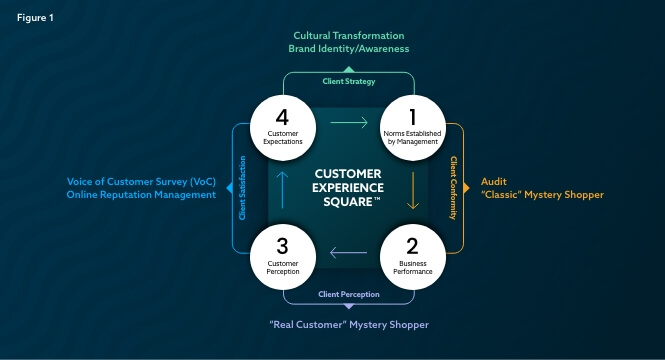
Why Each Metric Measures a Different Reality

Every metric has its own lens, tied to the method that generates it. Understanding where the data comes from means understanding what it can tell you, and especially what it cannot.

Mystery shoppers measure operational compliance. They evaluate whether your procedures are followed, your service standards applied, your protocols respected. This number is objective, reproducible, and independent of how the customer was feeling that day. It answers the question: is the machine running properly?

VoC surveys (Voice of Customer) measure the declared perception of customers who agreed to respond. In a VoC program, satisfied customers respond at higher rates. An NPS of 68 in this context is a solid result, but it reflects the perception of a subgroup, not the full customer base. That is the unavoidable limitation of any metric that depends on voluntary participation.

Google reviews capture the public, spontaneous voice, often with a strongly negative connotation. These are customers who felt the need to speak up without being asked, most often after a strongly negative experience. It is the rawest signal available, one that escapes all internal control. And it is also the one your future customers read first.

Relying on a single program and evaluating performance through a single metric does not give you a full view of the customer experience. Yet this is the reality of many organizations.

High compliance does not guarantee a memorable experience. And a good experience does not guarantee loyalty if your procedures lack consistency.

The Danger of Data Fragmentation

Let us go back to our restaurant chain. Compliance at 92%, NPS at 68, Google at 3.6 stars (strongly negative connotation).

When each department reads its own number in isolation, here is what happens:

  • The operations team is satisfied with 92%. Standards are being applied.
  • The marketing team is reasonably comfortable with an NPS of 68. Nothing alarming.
  •  The Google reviews? No one has clear ownership of analyzing them in connection with the other two sources.

The result: nobody sees the pattern. Nobody asks the real question: how is it possible to have such high compliance alongside such negative-leaning Google reviews?

The answer is hidden in the data. But only if you read it together.

What Integration Reveals

When you group your three metrics together, you start seeing what no single source can show on its own.

High compliance with negative-leaning Google reviews often reveals a gap between procedure and lived experience. Employees follow the steps, but without warmth, without authenticity, without the something that turns a transaction into a memorable moment.

A stable NPS alongside negative Google reviews targeting one specific location signals a localized problem that your aggregated survey data buries inside a national average.

Positive Google reviews concentrated at locations with lower compliance scores? Probably an exceptional field manager compensating through leadership for what the procedure does not dictate.

These patterns do not exist in your silos. They only appear when you bring the sources together.

The Customer Experience Square: A Simple Model, Complementary Methods!

Real operational intelligence does not come from a better tool. It comes from the ability to read multiple sources at the same time, in the same place.

Hexia: The Unified View

This is exactly what the Hexia platform makes possible: a consolidated view of your mystery shopper data (Hexia.missions), your VoC surveys (Hexia.voc), and your online reputation (Hexia.local). One single dashboard, in real time, accessible to your field teams and managers.

The more a CX organization is at an early stage of maturity, the more it should start with a compliance program. The more mature it becomes, the more it shifts weight toward perception rather than compliance, leaving room to adapt to what truly drives customer satisfaction. This is not a binary choice. It is an evolution.

No Excel files circulating by email. No meetings to reconcile numbers from different sources. No three tools open simultaneously in an attempt to spot a pattern.

One view. Three signals. Instantly.

See how your current data compares

Speak with our experts

Discover Hexia

What This Changes in Practice

When your data is integrated, decisions become faster and more targeted. You do not wait for a monthly review to discover that a location is drifting. Your field manager sees in real time that compliance is high, but Google reviews are showing strong negative signals on a specific service point. They can act today, not six months from now.

You identify locations where operational compliance is high but emotional satisfaction stagnates. You spot points of sale where Google reviews are showing strong negative signals while internal surveys still look positive.

And most importantly: you stop assuming your three numbers tell the same story. You finally understand what each one is saying, and especially what they reveal together.

That is the difference between data and intelligence. Between measuring and understanding.

About the Author

Christian Watier is Chief Scientific Officer at Lanla. He holds a doctorate in experimental psychology from Laval University and a postdoctoral fellowship from Carleton University. He has delivered more than 1,000 conferences and training sessions on customer experience across Canada and oversees all of Lanla’s CX research and measurement programs.


Latest news

Two Types of Mystery Shoppers, Two Types of Data
I’m often asked the same question in organizations that use mystery shopping: our scores are good.…
More
Les erreurs visibles vs invisibles
Why Silent Customers Cost More Than Those Who Complain
And how to hear those who don’t speak up, before they are already gone. The leader of a restaurant chain…
More
Angles Morts CX
92% Compliance, NPS 68, Google 3.6 Stars. Which One Should You Believe?
Why your customer experience data seems to contradict itself, and what that is actually costing you…
More
Moins de 30% de vos clients répondent à vos sondages de satisfaction.
Your Surveys Are Not Enough. And it’s not a questionnaire problem.
How to Measure What 70 to 90 Per Cent of Your Customers Will Never Tell You Directly. Picture…
More
App Lanla mises à jour Mars 2026
April 2026 Version Update: Performance Upgrades, Dark Mode & Airport Missions
We’ve refined the Lanla app to deliver a smoother, faster, and more reliable experience across all…
More
Marketing local : les leviers pour être visible près de vous
Local Marketing: Actionable Levers to Win “Near Me” Searches
To appear at the right moment, businesses need more than visibility. They need structured local signals…
More
Google met fin à la section Questions-Réponses
Google Q&A by API Is Retiring
Here’s How Businesses Can Stay Visible in AI Search For years, Google Q&A helped customers get…
More
google update 2025
Google update 2024 2025
Google Local SEO Update: 2024 Proximity and Experience Boost What changed? In mid-2024, Google rolled out…
More
Why Review Sites Matter More Than Ever for Your Business
Today’s customers rarely walk into a store or book a service without checking a few review…
More
Boost Your Visibility: Local Citations, Search Local & Organic SEO
In the competitive landscape of local search, mastering local citations, local search optimization, and organic SEO…
More
How to Optimize Your Google My Business Profile
Create a Google Business Account and Optimize Your Profile
In a hyperlocal digital landscape, being visible at the exact moment a customer is searching for…
More
Who Is the Target Audience?
Who Is the Target Audience? Why This Question Is Key to Your Success
Understanding who is the target audience for your business isn’t just marketing jargon; it’s the fundamental…
More
Social Listening
Master Your Brand’s Narrative with our Social Listening Solutions
In today’s dynamic digital landscape, truly understanding your audience requires more than just a presence –…
More
CRM
Strengthen Customer Relationships with Lanla’s CRM-Inspired Solutions
Effective customer relationship management (CRM) goes beyond just managing contacts — it’s about truly understanding and…
More
Looking for small jobs to make money
A smart alternative to small jobs to make money
If you’re exploring small jobs to make money — and want something meaningful and flexible —…
More
Mystery Shpopping and Conformity
Mystery Shopping: The Key to Consistent Brand Experience
For restaurant chains, hotel groups, senior living networks, bus & taxi fleets, retail businesses, and more,…
More